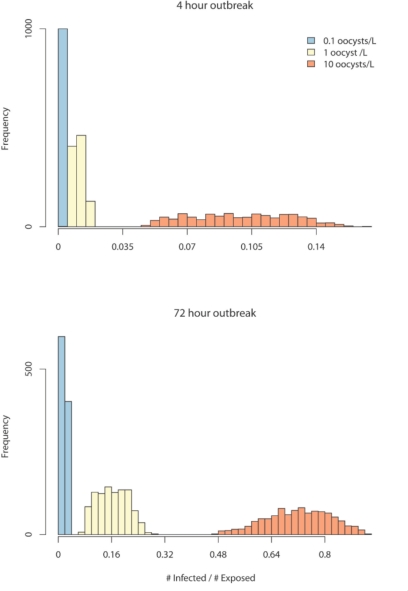
Figure 3.
Results from application of SnAP to the example scenario, highlighting the incorporation of random error and parameter uncertainty into simulation results. The variation in attack rates (#infected/#exposed) over 1,000 simulations is shown under two treatment failure scenarios and three concentrations of oocysts in the source water.

