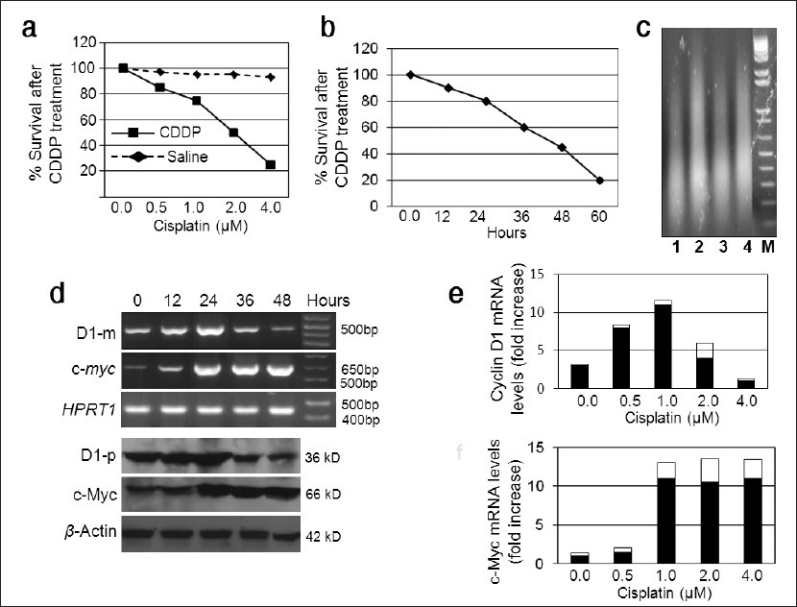
Figure 1.

Response of Ela-mycPT1 cells to CDDP treatment. (a) Dose response curve of Ela-mycPT1 cells to a 48-hour treatment with CDDP or saline (as vehicle). Note that IC50 was at about 2 μM. (b) Time course of 2 μM CDDP treatment. (c) DNA ladder assay showing smear DNA fragments stained by ethidium bromide in four (lanes 1-4) different experiments of Ela-mycPT1 cells treated with 2μM CDDP for 48 hours. “M” is a maker of DNA molecular weights. (d) D1 and c-myc expression in the cells treated with 2μM CDDP for the indicated time period. The top panel is the mRNA level detected by RT-PCR with HPRT1 as the loading control whereas the bottom panel is the protein level detected by western blot with β-actin as the loading control. (e and f) Densitometry quantification of the D1 (e) and c-myc (f) mRNA levels, which quantifies the band density in the agarose gel and then is calculated as the ratio to the density of the HPRT in the same sample
