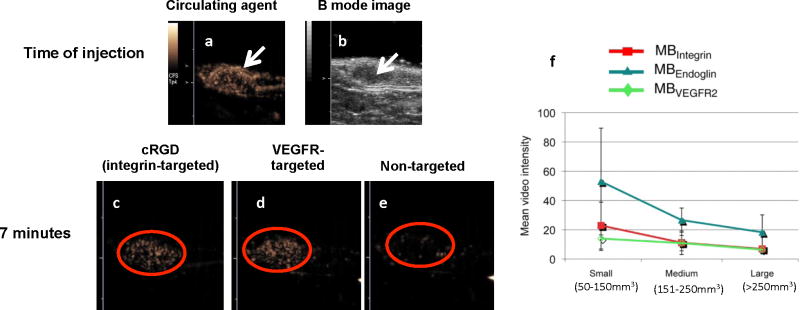
Figure 5. Examples of targeted agents from multiple ligand-receptor pairs obtained with CPS.
(a) CPS images of the circulating agent in a Met-1 syngeneic mouse tumor (arrow) immediately after injection and (b) the corresponding B-mode, anatomical image of the tumor region (arrow). Note abundant vasculature in the CPS image. (c–d) cRGD-conjugated [40] and scVEGF-conjugated microbubbles [51] accumulate within the Met-1 tumor to a greater extent than non-targeted microbubbles (e). (f) Mean targeted, contrast-enhanced US imaging signal intensities from longitudinal experiments in subcutaneous ovarian cancer xenografts in mice obtained by using integrin (red), endoglin (teal), and VEGFR2-targeted microbubbles (MB) (green). Absolute and relative US imaging signals were different among different tumor types and different MB types. Error bars = standard deviations.(f) reproduced with permission from [54].

