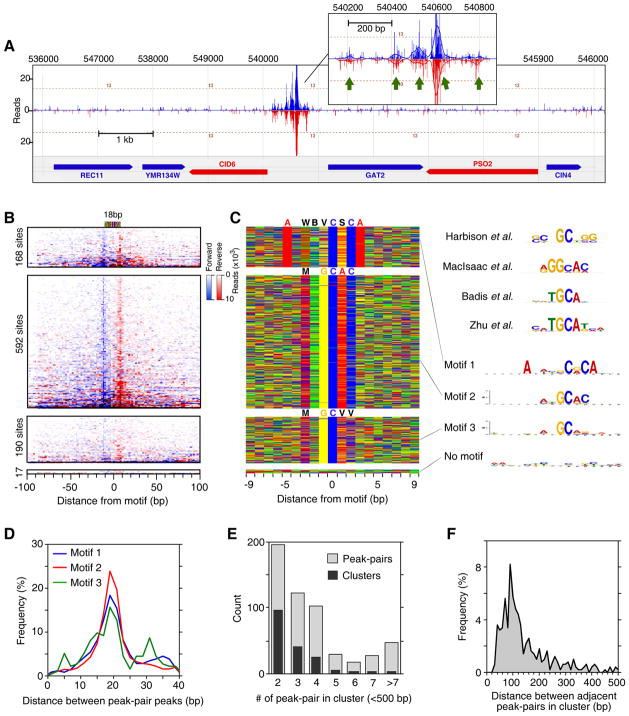
Figure 4. Genome-Wide Identification of Phd1-Bound Locations.
(A) Example of Phd1 binding at the GID6-GAT2 locus. Green arrows indicate Phd1 motifs. Vertical blue and red bars demarcate the 5′ ends of forward and reverse strand tags, respectively, shifted in the 3′ direction by 10 bp.
(B) Raw sequencing tag distribution around 967 Phd1-bound locations. Blue and red indicate the 5′ ends of forward and reverse strand tags, respectively, centered by the motif midpoint. Rows were divided into four groups based upon the type of motif shown in panel C, and sorted by Phd1 occupancy level. The additional tags distributed distal to the main peaks reflect multiple Phd1 peak-pairs residing near each other. See Figure S4C for Gene Ontology analysis.
(C) Color chart representation of 19 bp of sequence located between each Phd1 peak-pair, and centered by the motif midpoint. Each row represents a bound sequence ordered as in panel B. MEME logos for each group are shown to the right. The upper four logos were reprinted from the indicated references.
(D) Frequency distribution of Phd1 peak-pair distances for groups defined by motifs 1–3.
(E) Multiple Phd1 peak-pairs reside in clusters. Black bars indicate the number of Phd1 clusters found having the indicated number of peak-pairs within 500 bp of each other. Light bars indicate the total number of peak-pairs present in those clusters.
(F) Frequency distribution of distances between adjacent peak-pairs in clusters defined in panel E.

