
Figure 4.
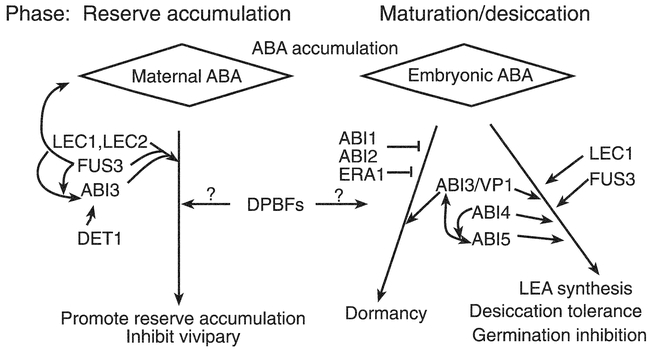
Schematic of signaling pathways in seed development. Arrows represent promotion of processes or expression of the regulators. Bars represent inhibitors of the indicated processes. Positions of loci do not imply order of gene action. Reprinted with permission from Finkelstein et al. (2002).