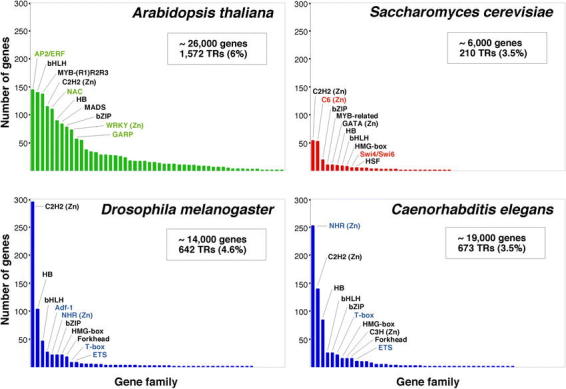
Figure 3.

Content and distribution of transcriptional regulator genes in eukaryotic genomes. For each of the organisms considered (A. thaliana, D. melanogaster, C. elegans, and S. cerevisiae), the different families of transcription factors are ordered according to the number of members that they contain. The 10 largest families in each organism are identified. The names of those families that are specific to one kingdom are shown in color. The data represented in this figure are from Table 1 and from Riechmann et al. (2000). The number of genes in each of the genomes is given as an approximate number (Goffeau et al., 1997; The C. elegans Sequencing Consortium, 1998; Adams et al., 2000; Arabidopsis Genome Initiative, 2000). This is because the number of genes predicted at the time that a genome is sequenced is always an estimate that is refined over time. The number of genes that code for transcriptional regulators (TRs), and the percentage of the total number of genes that they represent, is indicated. (Zn) indicates a zinc coordinating DNA binding motif.
