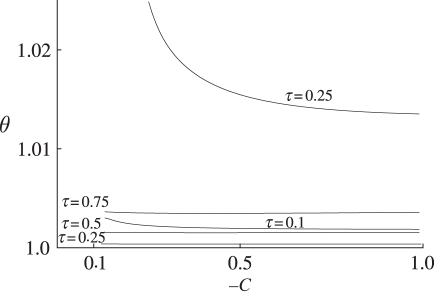
Figure 8.
One parameter orbit diagrams capturing two families of periodic attractors. One family is characterized by negligible change in the amplitude for C ∈ [−0.1, −1] (the values of τ are given to the left of the curves); the second family is characterized by a pronounced change in the amplitude for the values of C close to −0.1 (the values of τ are given above the curves).

