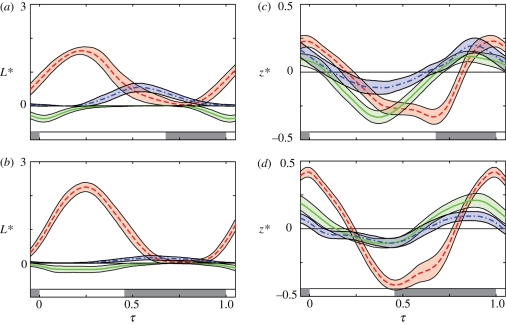
Figure 4.
Normalized vortex lift ( L*(τ)) and vertical position (z*(τ)) throughout the wingbeat for the different wake structures, consisting of the average spline and 95% confidence interval. The left panels show the L*(τ) at 3 m s−1 (a) and at 7 m s−1 (b), while the right panels (c,d) show the corresponding z*(τ) distributions. The different wake structures are tip vortex (red), root vortex (green) and tail vortex (blue). The grey colour bar at the bottom of each panel illustrates the upstroke section of the wingstroke.

