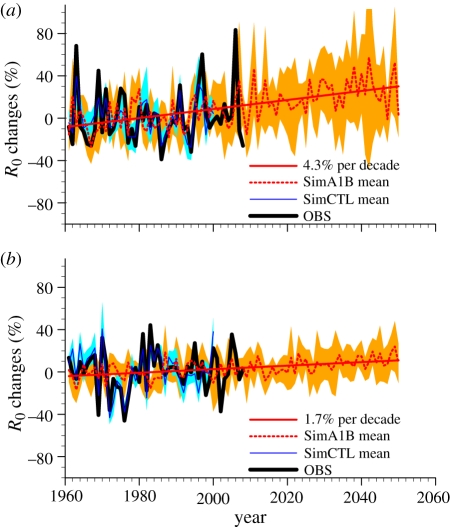
Figure 5.
Simulated R0 future evolution. R0 relative anomalies (%) with respect to 1961–1999 time period in ASO for (a) northwest and (b) southwest Europe (see figure 4 for the domain definition). R0 estimated from the climate observations (OBS) is displayed in black, the R0 ensemble mean based on the SimCTL (SimA1B) RCM ensemble is displayed in blue (red). The blue (orange) envelope highlights the spread (defined as 1 s.d. of each RCM realization to the ensemble mean) within the SimCTL (SimA1B) ensemble.

