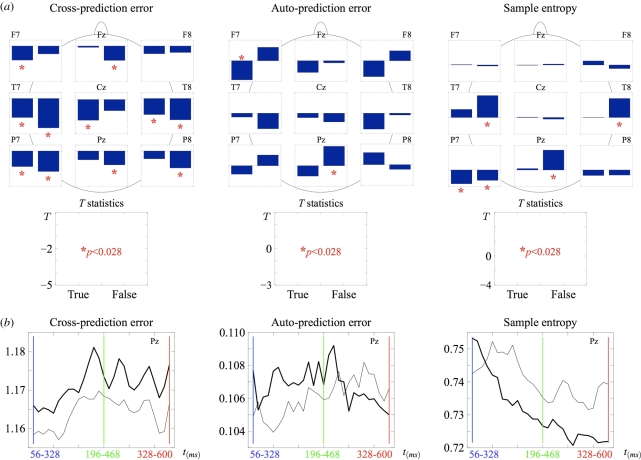
Figure 3.
(a) Paired-samples t-tests comparing CPE, APE and SampEn values between pre-access and post-access intervals in the true and false conditions over nine scalp electrodes. Significance values passing Bonferroni correction are marked with an asterisk. (b) Results of a sliding-window analysis of Pz data using a 272 ms time interval moved forward in 10 ms (five data points) increments. Mean CPE, APE and SampEn (N = 24) were computed for the optimal values of the reconstruction parameters m = 3 and τ = 1 at each increment. The window centred on the 328 ms boundary is shown in green. (b) Grey line, true; black line, false.

