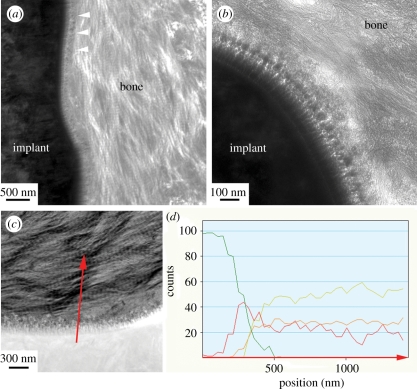
Figure 3.
Transmission electron micrographs of the laser-modified surface and bone. Bone tissue was observed in intimate contact with the implant surface. (a) Characteristic collagen banding was observed close to the implant (white arrow heads). (b) Higher magnification of the interface showing the surface oxide and bone tissue. (c) HAADF-STEM micrograph with a corresponding EDS line scan (red arrow). (d) Element distribution where an overlap zone was observed where calcium (yellow) and phosphorus (orange) increased simultaneously as the titanium (green) decreased and oxygen (red line) peaked, indicating osseointegration on the nano-level.

