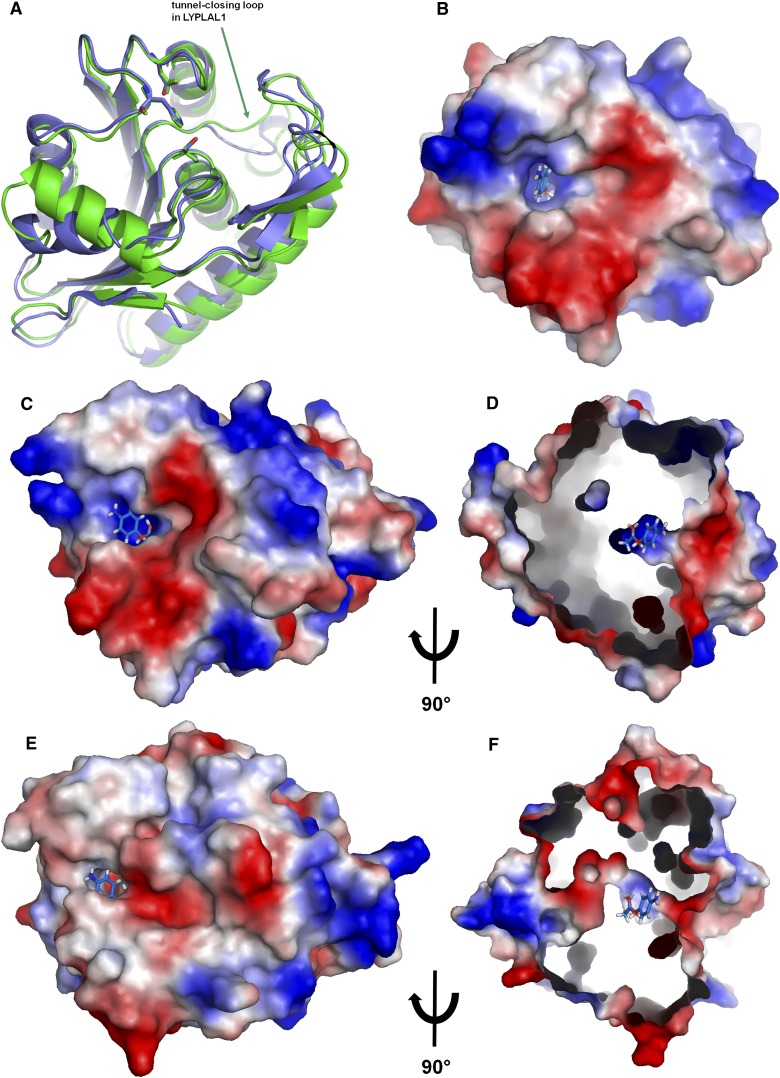
Fig. 2.
Structural representations of LYPLAL1. A: Crystal structure of LYPLAL1 compared with APT1 (PDB ID 1fj2). The catalytic triad is shown as sticks. B: Active site of LYPLAL1 with a docked 4-nitrophenyl acetate molecule in the same orientation as A. C–F: Comparison of the active site shape between LYPLAL1 [top (C and D)] and APT1 in the same orientation [bottom (E and F), PDB ID 1fj2]. D and F are shown in a side view and the surfaces are cut open to show the active site tunnel of APT1 extending through the protein, in contrast to the shallower active site of LYPLAL1 that does not form a tunnel. The 4-nitrophenyl acetate molecule docked into LYPLAL1 is shown in all four views for comparison. The surfaces are colored according to the electrostatic surface properties. Red represents negative, blue positive potential.

