Fig. 2.
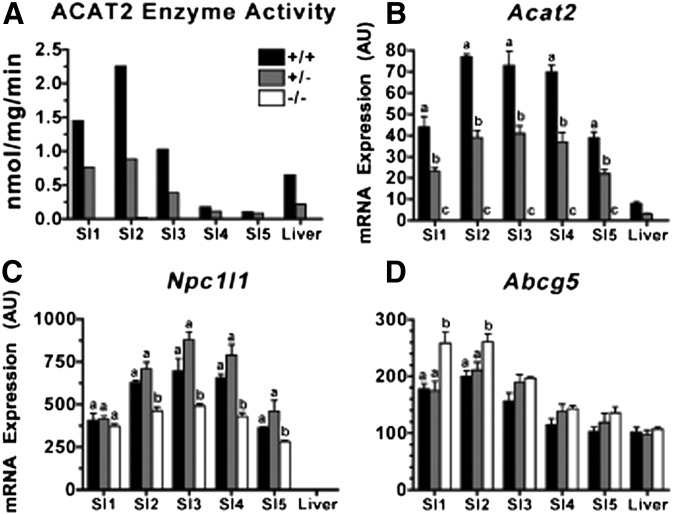
Impact of Acat2 gene dosage on ACAT2 enzyme activity and Acat2, Npc1l1, and Abcg5 mRNA expression in five segments of small intestine (SI) compared with liver. (A) Microsomal ACAT2 activity of tissue pools (n = 5/genotype). (B) Acat2, (C) Npc1l1, and (D) Abcg5 mRNA expression from individual samples are expressed as mean ± SEM (n = 5/genotype). All values for mRNA expressions are arbitrary units (AU) derived from real-time-PCR data normalized to mRNA expression of cyclophilin, a housekeeping gene, within the same sample. Different letters designate statistically significant differences (P < 0.05) within the same tissue, as measured by two-way ANOVA and Bonferroni posthoc tests.

