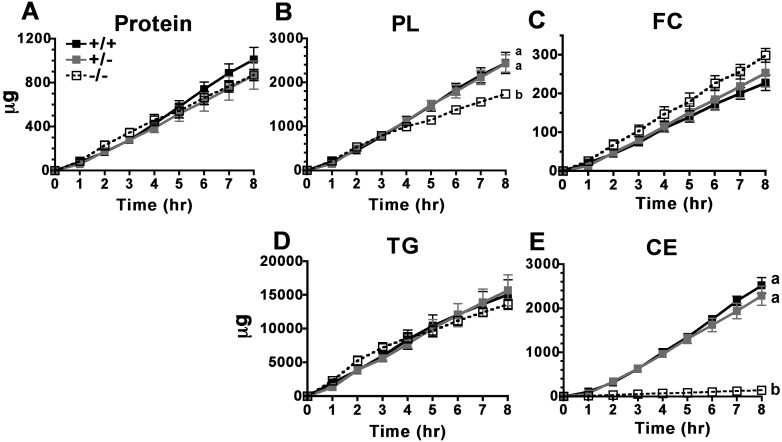
Fig. 6.
Cumulative chylomicron particle mass appearance over 8 h. Isolated chylomicrons were assayed for micrograms of (A) protein, (B) phospholipids, (C) free cholesterol, (D) triglyceride, and (E) cholesteryl ester per hourly collection of lymph. Data are expressed as mean ± SEM (n = 5/genotype). Different letters denote statistically significant differences (P < 0.05) as measured by two-way ANOVA and Bonferroni posthoc tests.

