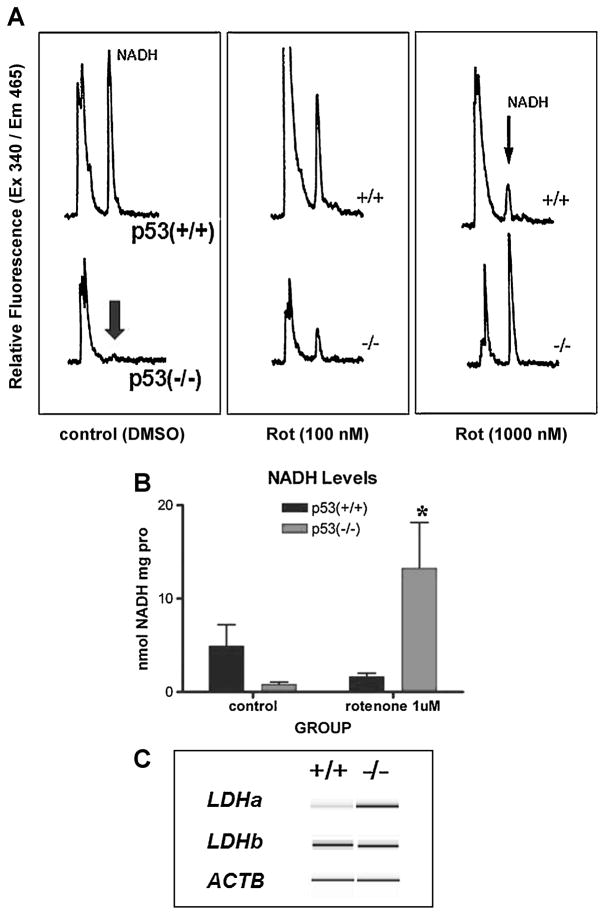
Fig. 1. Differences in metabolic markers correlate with p53 genotype.
A: Cells from wild-type p53 (+/+) mice treated with rotenone show a dose-dependent decrease in NADH content assessed by HPLC analysis. p53 (−/−) cells show an opposite effect with increased NADH levels upon rotenone (0, 100nM and 1000nM) treatment. B: Quantitative measurements show a remarkable inverted response to 500nM rotenone. Data were expressed as means ± SEM. Asterisk (*) indicates statistically significant *p ≤0.05 vs. p53 −/− control based on One-way ANOVA analysis. Post-hoc analysis was performed using the Dunnett’s test. C: Virtual gel reconstructed from electropherograms of PCR amplicon assay on the Agilent 2100 Bioanaylzer. mRNA gene expression levels were determined by relative RT-PCR for lactate dehydrogenase alpha and beta (ldha, ldhb) and actin (actb) control.

