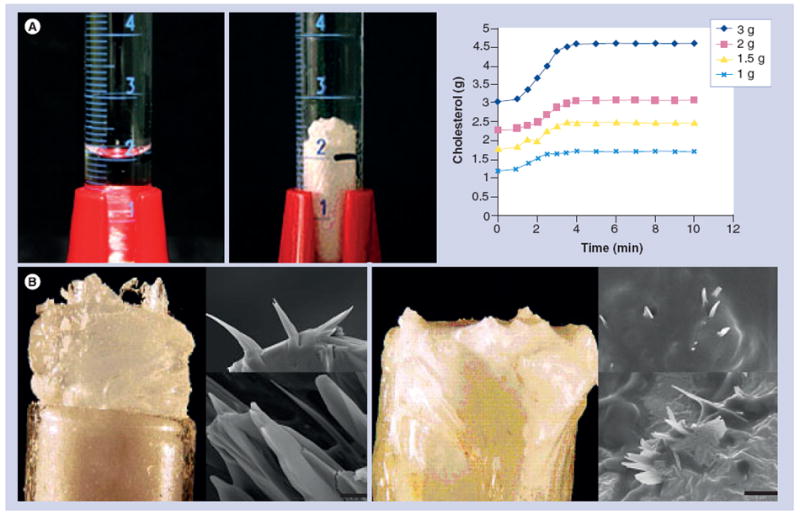
Figure 1. Demonstration of volume expansion of cholesterol during crystallization.

(A) Dissolved cholesterol in graduated cylinder expands in volume above the meniscus line. Graph of volume expansion is greater with increasing amounts of cholesterol (1–3 g). (B) Cholesterol crystals are seen growing above the edge of the test tube after crystallization. Scanning electron micrographs demonstrate sharp-tipped crystal geometries. When a fibrous membrane is placed over the mouth of the test tube, crystals perforate the membrane as noted by scanning electron microscopy (bar = 5 μm).
Reproduced with permission from [18].
