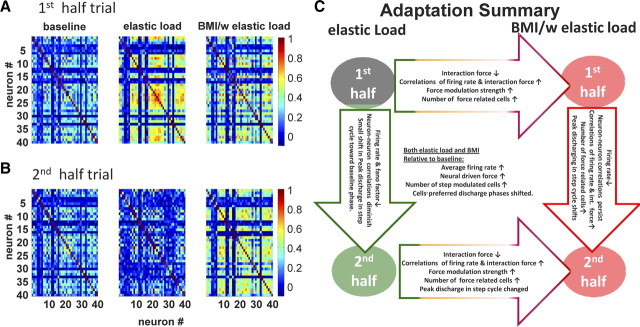
Figure 10.
Cell pair correlation coefficient and a sketch of the neural adaptation process. The cell pair correlation coefficient in half-trials across conditions (∼120 steps). A, The first half. B, The second half. The cell pair correlation matrix showed different patterns in different adaptation fields during locomotion. In the baseline condition (BL column), cell pair correlations showed a steady state across the whole trial (first half-trial vs the second half-trial). In the simple elastic load condition (E column), the cell pair correlations increased sharply in the first half-trial compared with baseline and then decreased to below the baseline condition in the second half-trial. In the first half-trial of the BMI with elastic load condition (BMI/E column), there was a moderate increase in the cell pair correlations compared with the baseline condition and the elastic load field condition, whereas in the second half-trial the cell pair correlations persisted rather than returning to the baseline condition like the simple elastic load condition. C, A simple diagram summarizes the overall neural modulation changes and differences that occurred under different field conditions and over time during the locomotion adaptation processes.

