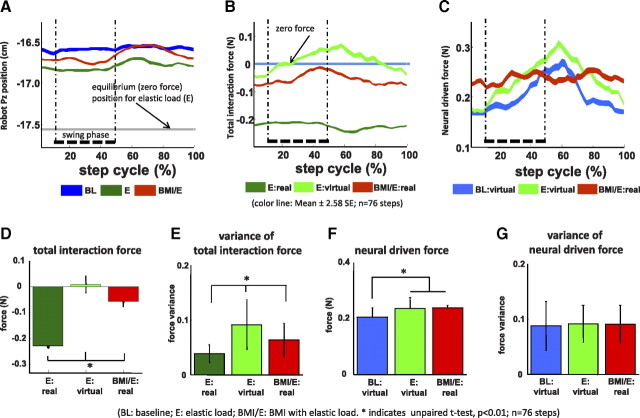
Figure 2.
Example of robot position patterns and forces patterns in one session in a rat (also shown in Figs. 4, 5, data). BL, Baseline; E, elastic load; BMI/E, BMI with elastic load. A–C, The average robot position (A), total interaction force (B), and neural driven force (C) in the step cycle (n = 76 steps) showed different patterns in the baseline, simple elastic load, and BMI with elastic load conditions. The equilibrium position of the load field (A, gray line) for the elastic load field in simple elastic load and BMI with elastic load conditions is shown in A. The thick dotted vertical lines correspond to the right leg swing phase in the average cycle. Colored ribbon lines shown corresponds to mean ± 2.58 SE. The rat showed more normal pelvic kinematics and less loading in BMI/E compared with E. D–G, Comparisons of mean and variance of interaction forces and neural driven forces in step cycle (n = 76 steps). D, There was a significantly decrease in the BMI with elastic load trials in mean interaction force compared with the preceding simple elastic load trials. The average total virtual interaction forces in simple elastic load (E:virtual), which were calculated by supposing the rats engaged in BMI with elastic load, were also significantly different from the real interaction forces in BMI with elastic load trial. E, The variances of the interaction force under elastic load and BMI with elastic load conditions were also significantly different and were highest in E:virtual. F, The mean virtual neural driven forces in baseline were significantly different from the mean virtual neural driven forces in simple elastic load and the mean real neural driven forces in BMI with elastic load. G, The variances of the neural driven forces were not significantly different (p > 0.05) between simple elastic load, baseline, and BMI with elastic load conditions. Statistics was applied by two-sample t test (*p < 0.01; n = 76 steps). Thus, the different offset of force and reduced variance of interaction force seen in BMI with elastic load compared with E and E:virtual was likely attributable to specific coordination patterns, as suggested in C. Error bars indicate SD.

