FIGURE 2.
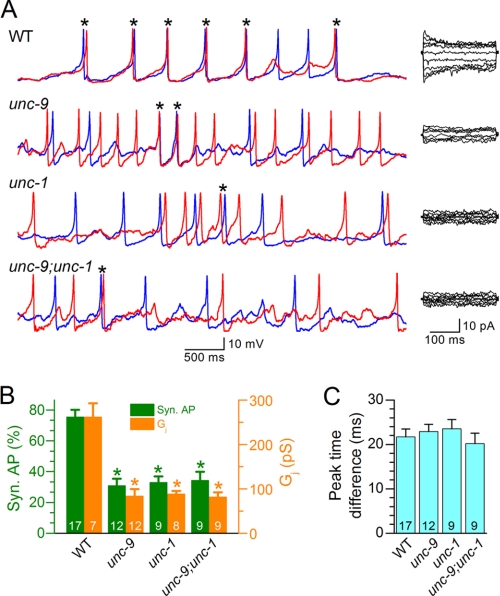
Action potential synchrony and junctional conductance were compromised in unc-9 and unc-1 mutants. APs and junctional currents were recorded from the L1L2 and R1R2 pairs of muscle cells of unc-9(fc16), unc-1(e719), and the double mutant unc-9(fc16);unc-1(e719). The data were compared with the same WT data shown in Fig. 1. A, representative traces of APs (left panel) and junctional currents (right panel) from the WT and mutant worms. The red and blue traces show temporal correlation between APs from the two cells in each pair. B, percentages of synchronous APs and levels of junctional conductance (Gj) in different groups. The asterisk indicates a significant difference compared with the corresponding WT data (p < 0.01, one-way ANOVA with Bonferroni post hoc test). C, the peak time difference for synchronous APs among the different groups. In both B and C, the data are shown as the means ± S.E., and the number of cell pairs analyzed is indicated inside the column.

