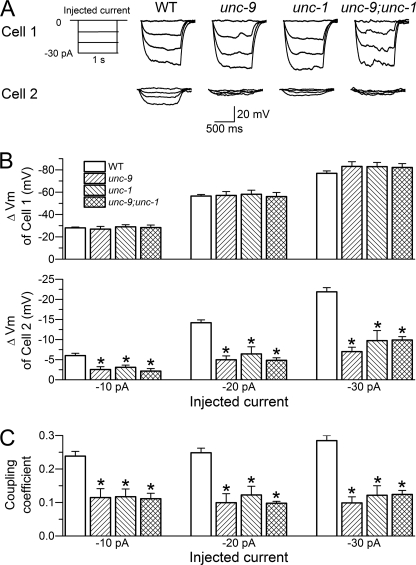
FIGURE 3.
Coupling coefficient was greatly decreased in unc-9 and unc-1 mutants compared with the wild type. The mutants analyzed were unc-9(fc16), unc-1(e719), and the double mutant unc-9(fc16);unc-1(e719). Negative currents were injected into one muscle cell, whereas membrane voltage changes in response to the current injections were measured in both the injected cell (Cell 1) and a contacting neighboring cell (Cell 2) of the L1L2 or R1R2 pair. A, diagram of the current injection steps (left panel) and representative membrane voltage traces (right panel). B, membrane voltage changes (ΔVm) in response to the current injections in Cell 1 and Cell 2. C, the coupling coefficient (the ratio of ΔVm of Cell 2/ΔVm of Cell 1). In both B and C, the data are shown as the means ± S.E., and the asterisk indicates a significant difference compared with the WT (p < 0.01, one-way ANOVA with Bonferroni post hoc test). The number of cell pairs analyzed was 33 for WT, 13 for unc-9, 13 for unc-1, and 12 for the double mutant.

