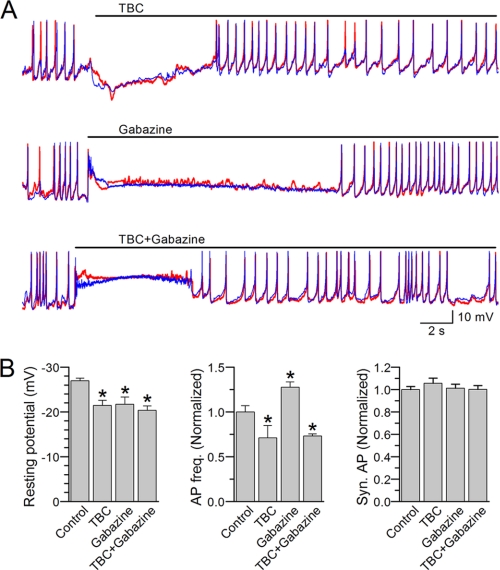
FIGURE 7.
Action potentials remained synchronous after blocking acetylcholine and/or GABAA receptors. APs were recorded from the L1L2 and R1R2 pairs. A, representative AP traces showing the effects of (+)-tubocurarine (TBC, 0.5 mm) and/or gabazine (0.5 mm). The red and blue traces show temporal correlation between APs from the two cells in each pair. B, effects the various treatments on the resting membrane potential, AP frequency, and AP synchrony. Comparisons were made between the control period (before the treatment) and during the treatment period with the asterisk indicating a significant difference (p < 0.05, paired t test). AP frequency and synchrony percentage were subsequently normalized by values of the control period and displayed in the bar graphs. The data are shown as the means ± S.E. The numbers of cell pairs analyzed were five for TBC, six for gabazine, and five for TBC plus gabazine. The control in the graphs represents pooled data.

