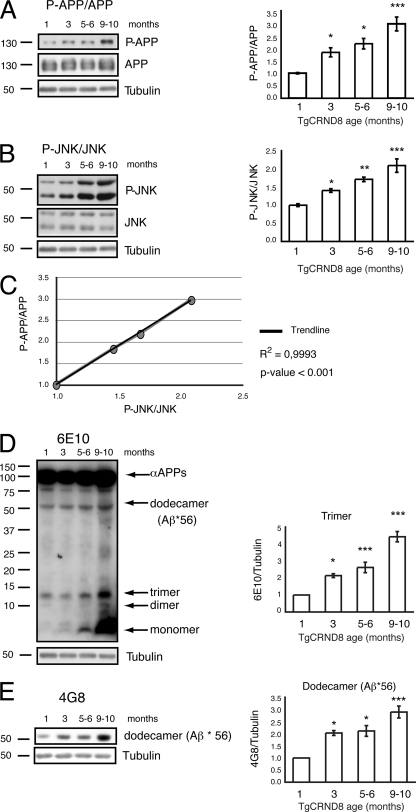
FIGURE 1.
JNK activation correlates with an increase in APPThr-668 phosphorylation and Aβ oligomers in TgCRND8 mice. A, p-APP/APP levels increased with disease progression in TgCRND8 mice as showed by the representative Western blot and relative quantification. Data are expressed as mean ± S.E. (one-way ANOVA). *, p < 0.05; ***, p < 0.001 versus 1 month (n = 8); Dunnett's post hoc test. B, p-JNK levels increased with disease progression in TgCRND8 mice as showed by the representative Western blot and relative quantification. Data are expressed as mean ± S.E. (one-way ANOVA). *, p < 0.05; **, p < 0.01; ***, p < 0.001 versus 1 month (n = 8); Dunnett's post hoc test. C, correlation curve of p-APP and p-JNK in TgCRND8 mice at different time points are indicated by the black circles (R2 = 0.9993; p < 0.001). D, representative Western blot showing the formation of toxic soluble Aβ forms (dimers, trimers) with increasing age in TgCRDN8 mice. Bar graphs show densitometric analysis of Western blots. Data are expressed as mean ± S.E. (one-way ANOVA). *, p < 0.05; ***, p < 0.001 versus 1 month (n = 8); Dunnett's post hoc test. E, increased formation of dodecamers with increasing age was detected in TgCRND8 mice by Western blotting. Bar graphs show densitometric analysis of Western blots. Data are expressed as mean ± S.E. (one-way ANOVA). *, p < 0.05; ***, p < 0.001 versus 1 month (n = 8); Dunnett's post hoc test.

