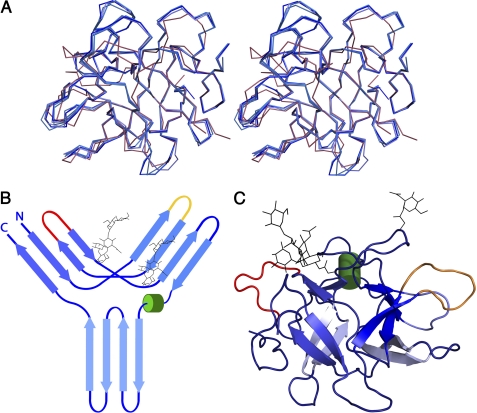
FIGURE 1.
Crystal structure of PPI and schematic representation of the β-trefoil fold. A, stereo view of the superposition of the Cα trace of all four PPI monomers onto the Cα trace of STI. B, topology diagram of PPI, showing the typical β-trefoil fold of the Kunitz-STI family. Cylinders represent helices, and arrows represent strands. C, graphic representation of the crystal structure of PPI as observed in the crystal structure. The two known glycosylation sites, Asn-84 and Asn-90, are represented as black lines, and the reactive loops β2-β3 and β4-β5 are in yellow and red, respectively.

