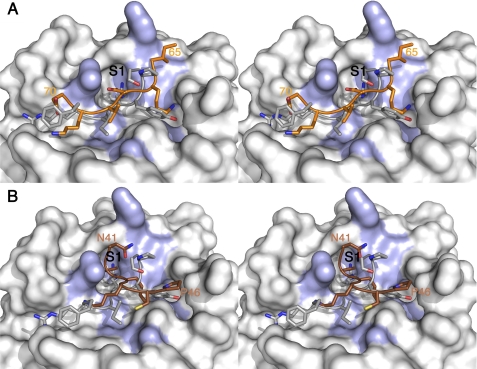
FIGURE 3.
Details of the interactions between PPI and trypsin based on the docking models. A and B, stereo view of the interactions involving the reactive loops β2-β3 (A) and β4-β5 (B) in orange in comparison with the canonical loop from STI (in silver). The main residues on the surface of trypsin, interacting with PPI are colored in blue, and the S1 pocket is labeled in black.

