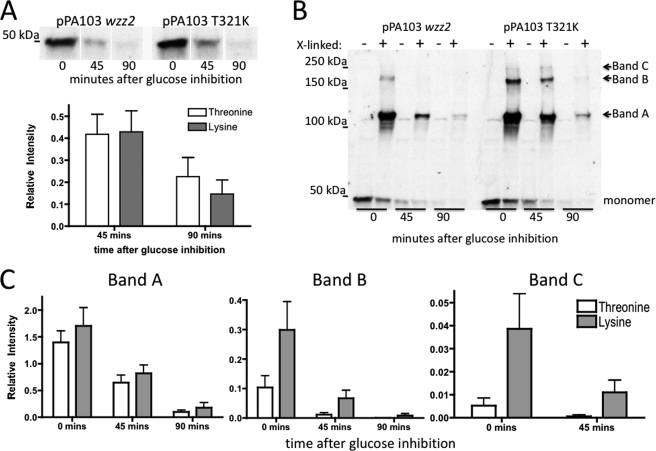
FIGURE 4.
Stability of Wzz2 oligomers. A, expression levels from whole cell lysates were compared before addition of glucose (time 0) and at 45 and 90 min after inhibition. The experiment was repeated three times with PA103 Wzz2, PA103 T321K Wzz2, 9882-80 Wzz2, and 9882-80 K321T Wzz2. Densitometry was performed with ImageJ software, and relative intensity was normalized to the amount of protein present in the time 0 sample. The top panels show protein expression from a representative experiment, and the bottom panel illustrates densitometry results for whole cell lysates. The white bars indicate threonine versions (PA103 Wzz2 and 9882-80 K321T Wzz2), whereas gray bars indicate lysine versions (PA103 T321K Wzz2 and 9882-80 Wzz2) of the proteins. B, samples were cross-linked for 1 h and then boiled. The blot is representative of an example. Relative intensity of each band was normalized to the intensity of the protein amount present in the whole cell lysate at time 0. −, whole cell lysate samples; +, samples subjected to formaldehyde cross-linking. C, graph of relative intensities of different oligomer bands (indicated in margin of B) at different time points. One-way analysis of variance analysis was used within the GraphPad Prism program to determine statistics.

