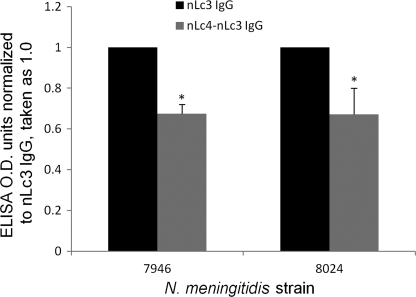
FIGURE 3.
Binding of nLc3 (black bars) and nLc4-nLc3 (gray bars) LOS IgG to N. meningitidis strains, 7946 and 8024. Each IgG was tested at a concentration of 10 μg/ml. y axes are ELISA OD units normalized to the binding of nLc3 LOS IgG, which was assigned a value of 1.0. Error bars, S.D.; *, difference between the binding of nLc4-nLc3 IgG and nLc3 IgG to each strain was significant (p < 0.05; t test).

