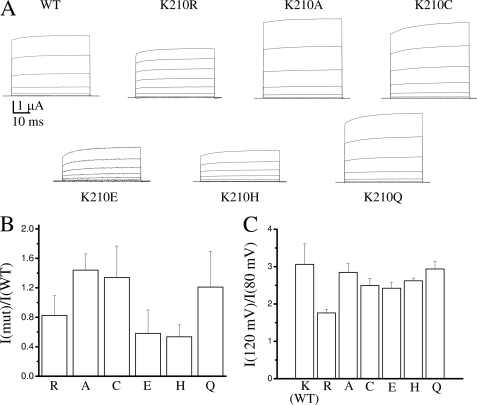
FIGURE 2.
Expression and rectification of the currents for WT CLC-5 and Lys210 mutants. A, representative current recordings for WT and the indicated mutants. B, average of the ratio between the current of WT and the indicated mutants at 100 mV. In each batch of oocytes, the ratio was calculated by dividing the average current of the mutants and the WT. Data were obtained for at least three batches (n ≥ 7). Error bars are S.D. The average current of the WT was 5.7 ± 1.8 μA (n = 38). C, average values of the ratio of currents at 120 and 80 mV calculated for each individual oocyte for WT (Lys210) and the indicated mutants (the number of experiments is the same as in panel B, error bars are S.D.). The difference with the WT value is statistically significant for K210R (p < 10−6) and K210C and K210E (p < 0.05).

