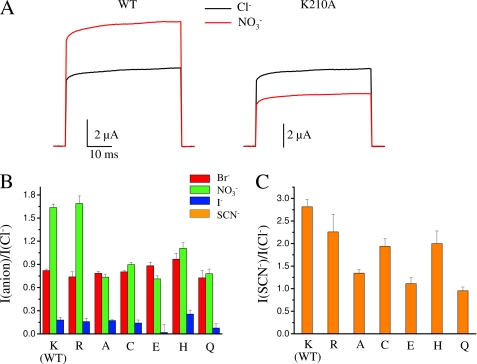
FIGURE 3.
Selectivity of WT CLC-5 and Lys210 mutants. A, representative current recordings in Cl− solution (black trace) and NO3− solution (red trace) at 100 mV for two oocytes expressing WT CLC-5 and the mutant K210A, respectively. The ratio INO3−/ICl− was 1.61 for WT and 0.67 for K210A. Traces for K210A were scaled to obtain the same current level in Cl− solution for WT and K210A. B, average currents in Br−, NO3−, and I− relative to Cl− at 100 mV (n ≥ 7). The difference with the WT value of INO3−/ICl− is statistically significant for all the mutants (p < 0.01), for IBr−/ICl− and IIodide−/ICl− is statistically significant only for K210H (p < 0.05). C, average of the currents in SCN− relative to Cl− at 80 mV (n ≥ 7). The difference with the WT value is statistically significant for K210A, K210E, and K210Q (p < 0.05).

