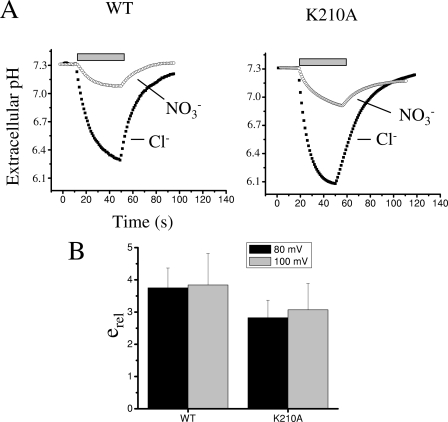
FIGURE 5.
Proton transport properties of WT and K210A. A, representative recordings of the extracellular acidification produced by the activation of WT and K210A. Horizontal gray bars indicate stimulation with trains of voltage pulses to 80 mV (400 ms duration) in Cl− (filled squares) and NO3− (open circles) solutions. B, average coupling efficiency of Cl− and NO3− with H+ transport, erel (Equation 8), at 80 and 100 mV measured for WT (n = 4) and K210A (n = 6) (errors bars are S.D.). The difference is not statistically significant (p > 0.05).

