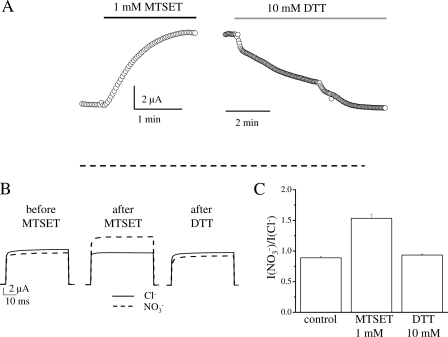
FIGURE 6.
MTSET modification of K210C. A, representative current recordings showing the effect on the stationary current level of 1 mm MTSET (application indicated by a black bar) and of the washout with 10 mm DTT (indicated by a gray bar). Both reagents were dissolved in measuring solution containing 100 mm NO3−. Voltage protocol consisted of a 20-ms pulse to 80 mV applied every 2 s. After MTSET application the experiment was interrupted to record I-V relationships in Cl− and NO3− solutions. The dashed line represents the 0 current level. B, representative current recordings in Cl− (solid trace) and NO3− (dashed trace), at 100 mV from the same oocyte as shown in panel A (before and after MTSET application and after washout with DTT). In these conditions the value of INO3−/ICl− was, respectively, 0.89, 1.50, and 0.91. C, average value of INO3−/ICl− before and after MTSET application (n = 15) and after DTT washout (n = 6). The increase of INO3−/ICl− after MTSET modification is statistically significant (p < 10−6).

