FIGURE 1.
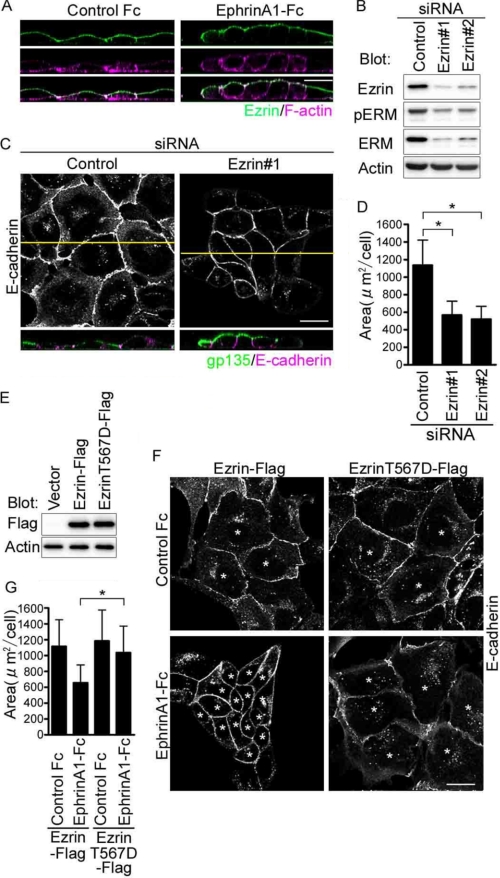
EphrinA1/EphA2 signal induces compaction by inhibiting Ezrin that maintains the flat shape of MDCK cells. A, the confocal XZ images of the MDCK cells immunostained with anti-Ezrin and stained with rhodamine-phalloidin after the stimulation of either control Fc (left panel) or ephrinA1-Fc (right panel) for 4 h. B, immunoblot analyses with the antibodies indicated at the left using the cell lysates from the MDCK cells treated with siRNAs indicated on the top. C, MDCK cells immunostained with anti-E-cadherin and anti-gp135 after the treatment with siRNAs indicated on the top. The confocal XY image displays the channel of Alexa 546 detecting anti-E-cadherin (top panel). The XZ image displays both channel of Alexa 488 detecting anti-gp135 and Alexa 546 detecting anti-E-cadherin (bottom panel). The yellow line in the XY image denotes the plane for the XZ image. D, area of the cells treated with siRNAs indicated at the bottom in E was calculated by measuring the individual cell area (at least more than 100 cells in each experiment) using the MetaMorph as described under “Experimental Procedures.” The value (area) indicates the mean with S.D. E, immunoblot analyses with the antibodies indicated at the left using the lysates from the cells transfected with the plasmid indicated at the top. F, the confocal XY images of the cells transfected with the plasmids indicated at the top, stimulated with either control Fc or ephrinA1-Fc for 4 h, and immunostained with E-cadherin. Asterisks indicate the cells expressing Ezrin-FLAG. G, area of the cells marked by asterisks in F was calculated as described for D. Bar, 20 μm (throughout the figures).

