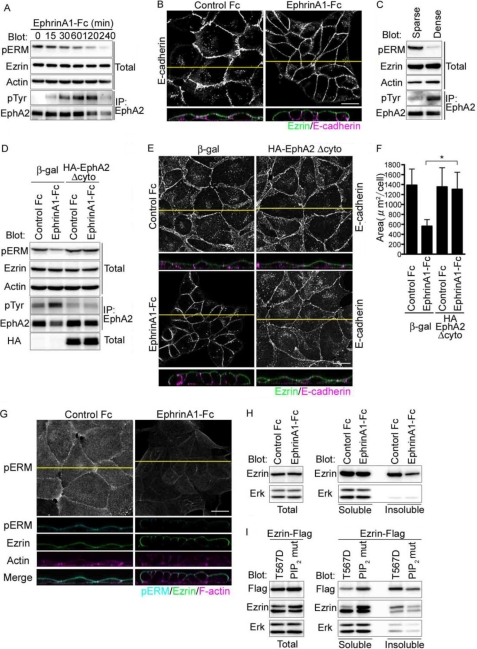
FIGURE 2.
EphrinA1/EphA2 signal induces dephosphorylation of Ezrin. A, immunoblot analyses using the antibodies indicated at the left using the cell lysates (total) or the immunoprecipitates with anti-EphA2 (IP: EphA2) prepared from the cells treated with ephrinA1-Fc during the time indicated at the top. B, the confocal images of MDCK cells immunostained with anti-Ezrin and anti-E-cadherin after the stimulation with either control Fc (left) or ephrinA1-Fc (right) for 4 h. The XY image displays the channel of Alexa 546 detecting anti-E-cadherin. The XZ image displays two channels of both Alexa 488 detecting anti-Ezrin and Alexa 546 detecting anti-E-cadherin. The yellow line denotes the plane for the confocal XZ image. C, immunoblot analyses with the antibodies indicated at the left using the cell lysates (total) or the immunoprecipitates with anti-EphA2 (IP: EphA2) from the cells cultured at either sparse or dense condition. D, immunoblot analyses of the immunoprecipitates using anti-EphA2 (IP: EphA2) or cell lysate (total) from the MDCK cells infected with the adenovirus expressing either β-galactosidase (β-gal) or HA-tagged EphA2 lacking cytoplasmic domain (HA-EphA2Δcyto) indicated at the top using antibodies indicated at the left. E, confocal images of the MDCK cells infected with the adenovirus indicated at the top after the treatment of either control Fc (upper panels) or ephrinA1-Fc (lower panels). The top (XY) and bottom (XZ) panels were the confocal images for the cells immunostained with anti-E-cadherin or with both anti-E-cadherin and anti-Ezrin, respectively. The yellow lines in the XY image denote the plane for the confocal XZ image. F, quantitative analyses of the individual cell area calculated using XY images of E. G, the image for phospho-ERM (top panels) is the projection image of stacked XY image. The lower panels are the confocal images of the MDCK cells immunostained with anti-phospho-ERM (pERM) or anti-Ezrin and stained with Alexa Fluor 633 phalloidin after ephrinA1-Fc stimulation. The XZ images display the merged image of pERM, Ezrin, and F-actin (bottom panel). H, immunoblot analyses of the lysate (left panel) and the soluble or insoluble fraction (right panel) of the MDCK cells treated with either ephrinA1-Fc using the antibodies indicated at the left. I, immunoblot analyses of MDCK cells fractioned after the transfection with the plasmids expressing FLAG-tagged either the phosphorylation mimic mutant (T567D) or that incapable of PIP2 binding (PIP2 mut) as described under “Experimental Procedures” using the antibodies indicated at left.

