FIGURE 7.
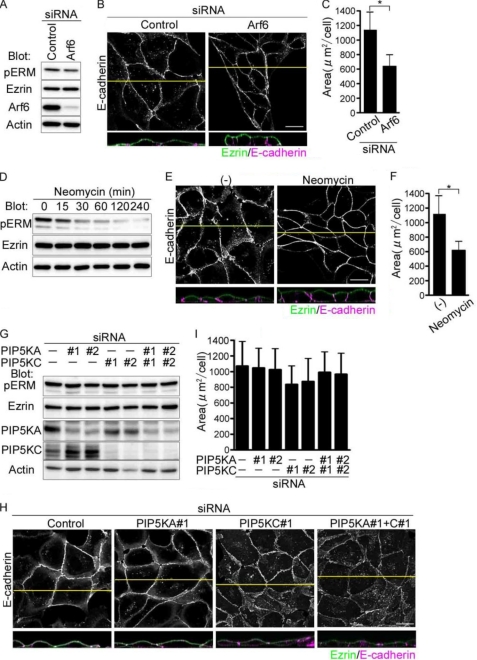
EphrinA1/EphA2 signal induces cell compaction via inactivation of Ezrin independently of Arf6-mediated signaling. A, immunoblot analyses with the antibodies indicated at the left using the cell lysates of the MDCK cells treated with siRNAs indicated at the top. B, the confocal images of the cells transfected with siRNAs indicated at the top are shown as described in the legend of Fig. 2B. C, area was analyzed as described in the legend of Fig. 1D. D, immunoblot analyses with the antibodies indicated at the left using the cell lysates from the MDCK cells treated with neomycin during the time indicated at the top. E, confocal images of the MDCK cells treated with neomycin for 4 h were obtained as described in the legend of Fig. 2B. F, area of the cells treated with neomycin was calculated as described in the legend of Fig. 1D. G, immunoblot analyses with the antibodies indicated at the left using the lysates from the MDCK cells treated with the siRNAs for PIP5K-A (PIP5KA) and/or PIP5K-C (PIPK5C). H, the confocal images of the cells treated with siRNAs indicated at the top were shown as described in the legend of Fig. 2B. I, area of the cells of H was quantitatively analyzed as described in the legend of Fig. 1D.

