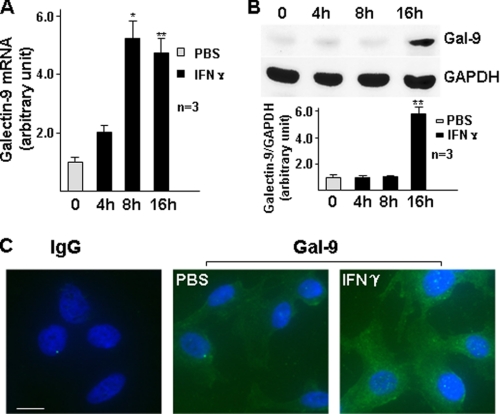
FIGURE 1.
IFN-γ induces galectin-9 expression in HUVECs at mRNA and protein levels. A and B, HUVECs were treated with 10 ng/ml IFN-γ for the time indicated, followed by quantitative RT-PCR analysis of galectin-9 mRNA (A) and Western blot analysis of galectin-9 protein (B, lower panel represents the relative galectin-9 protein level to GAPDH). *, p < 0.05; **, p < 0.01. C, HUVECs were treated with 10 ng/ml IFN-γ for 16 h, followed by immunofluorescent staining with galectin-9 antibody (green). DAPI was included to counterstain the nucleus (blue). PBS was used as vehicle control. IgG was included as primary antibody control of the staining. Scale bar, 5 μm. Note that the fluorescence intensity in IFN-γ-treated cells is significantly higher than untreated cells. Data presented are representative of mean ± S.E. (error bars) of three independent experiments.

