FIGURE 3.
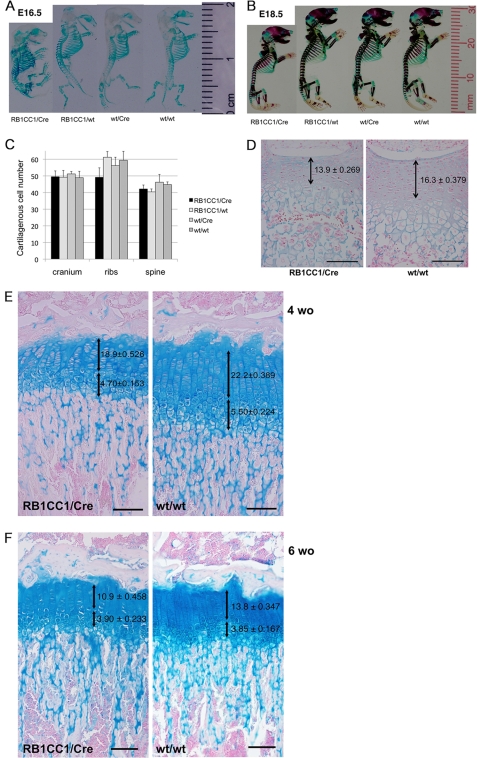
Col2-RB1CC1 caused the dwarf phenotype with a balanced reduction between cartilaginous cell numbers and extracellular chondroid matrices and without abnormal endochondral ossification. A and B, skeletal samples from day 16.5 (A) and day 18.5 (B) embryos indicated that the dwarf phenotype with less chondroid volume was seen in Col2-RB1CC1 (RB1CC1/Cre) mice. C, no significant difference was seen in the cell numbers of 100 μm2 of various cartilage tissues from each mouse (p = 0.062, cranium; p = 0.254, ribs; p = 0.186, spine). D, lesser cell numbers and fewer chondroid matrices were significantly indicated in the spinal growth plates of day 18.5 Col2-RB1CC1 (RB1CC1/Cre) embryos (p < 0.0001). E and F, lesser cell numbers and fewer chondroid matrices were significant in the columnar proliferating chondrocytes of tibial growth plates of 4-week-old (E; p < 0.0001) and 6-week-old (F; p < 0.0001) Col2-RB1CC1 (RB1CC1/Cre) infants. Numbers of hypertrophic chondrocytes were less in 4-week-old RB1CC1/Cre tibias (E; p = 0.0085). The values indicate the means ± S.E. of cartilaginous cell numbers of one column in the proliferating and hypertrophic zones from 5–6 mice of each genotype. One-way factorial analysis of variance and multiple comparison tests accompanied by Scheffe's significance were used to evaluate the relationships between genotypes and cartilaginous cell numbers. Macroscopically and microscopically, no abnormality was seen in the endochondral ossification of all of the mice (RB1CC1/Cre, RB1CC1/wt, wt/Cre, and wt/wt). Scale bar, 100 μm.

