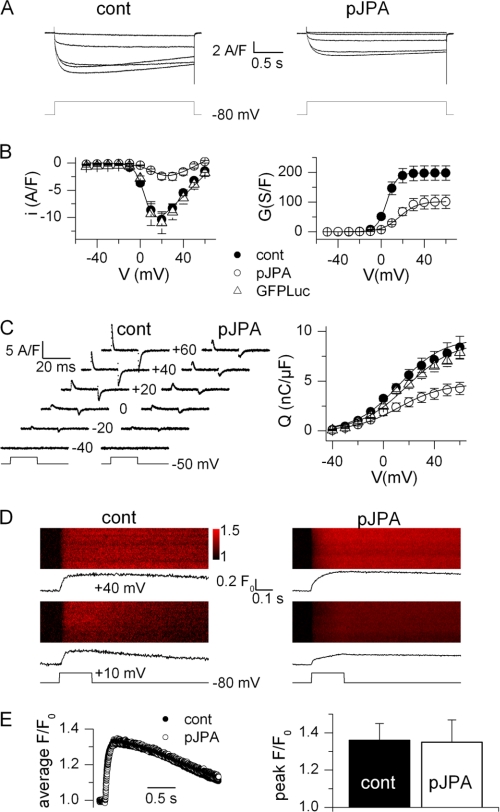
FIGURE 4.
DHPR-mediated Ca2+ entry, charge movement, and Ca2+ release in control and JP knockdown C2C12 myotubes. A, Ca2+ current traces obtained in a control myotube (cont, left) and in a pSuperJPAi-GFP-positive myotube (pJPA, right) in response to the depolarizing pulse protocol illustrated below. B, mean voltage dependence of the peak Ca2+ current density (left) and corresponding mean maximum conductance (right) in control (n = 5), pSuperJPAi-GFP-positive (n = 6), and pSuperLuc-GFP-positive (n = 5) myotubes. Superimposed lines were calculated from the average values of the parameters obtained from fitting the appropriate function to the individual series of data (see ”Experimental Procedures“). C, left, charge movement currents measured in a control and in a pSuperJPAi-GFP-positive myotube at the indicated values of membrane potential. Right, mean voltage dependence of charge density in control (n = 13), pSuperJPAi-GFP-positive (n = 9), and pSuperLuc-GFP-positive myotubes (n = 10). Superimposed lines were calculated from the average values of the parameters obtained from fitting a Boltzmann function to the individual series of data. D, line-scan images of the rhod-2 fluorescence taken from a control myotube (left) and from a pSuperJPAi-GFP-positive myotube (right). Vertical size corresponds to 100 μm. Myotubes were stimulated by a 200-ms-long voltage clamp depolarization from −80 mV to the indicated level. The average time course of change in rhod-2 fluorescence is shown underneath each line-scan image. E, left, average rhod-2 fluorescence transient elicited by a depolarizing pulse to +40 mV in nine control and seven pSuperJPAi-GFP-positive myotubes. Right, corresponding mean (± S.E.) peak amplitude of the rhod-2 transient in the two sets of myotubes.

