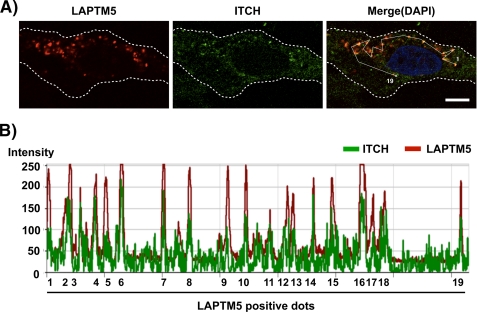
FIGURE 3.
Intracellular distribution of LAPTM5 and ITCH in 8305C cells. A, 8305C cells were plated on coverslips in 24-well plates (1 × 10⁵/well) and were infected the next day with Ad-LacZ or Ad-LAPTM5. After 2 days, the cells were fixed, immunoreacted with anti-LAPTM5 antibody and goat anti-ITCH antibody, and visualized using Alexa Fluor 594-conjugated anti-rabbit (red) or FITC-conjugated anti-goat IgG antibody (green). The images were obtained by confocal microscopy. Bar, 10 μm. B, the fluorescence intensity distribution for LAPTM5 and ITCH on 19 spots that a white line passed is shown in the lower panel.

