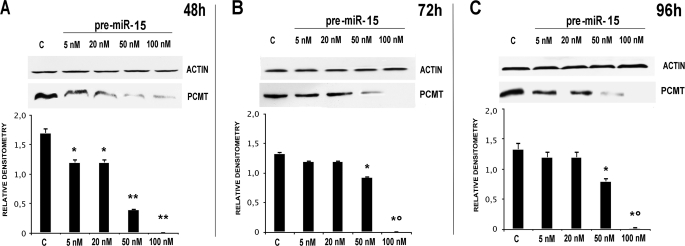
FIGURE 2.
Effects of HepG2 transfection with pre-miRNA 15a on PCMT1 expression. Each panel reports the results of the treatment with increasing concentrations (as indicated at the top of each lane) of the miRNA, at various time points (panels A–C, respectively). Each panel reports the actual Western blot analysis for PCMT1 (upper half) with the relevant densitometric scan (lower half). In each panel the first lane, marked with c, is relevant to a scrambled miRNA control. *, p < 0.05; **, p < 0.01; *°, p < 0.001.

