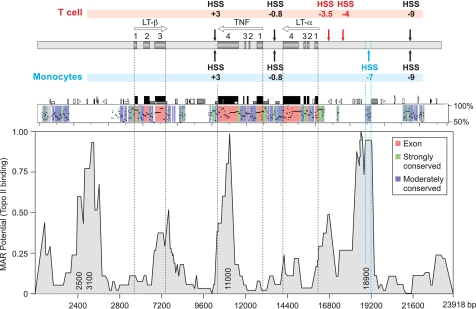
FIGURE 2.
HSS−7 sequence conservation and MAR potential. Upper, diagram of the TNF, LT-α, and LT-β genes in the TNF locus relative to hypersensitive sites present in T cells (above) and monocytes (below), with genes and exons labeled as described in the legend to Fig. 1. Middle, PipMaker (20) alignment of the murine and human TNF loci showing percent identity to the human sequence (y axis), exons (red), and strongly (green) and moderately (blue) conserved noncoding regions. Lower, MAR potential of the aligned 23.5-kb fragment shown in PipMaker (with nucleotide positions on the x axis) as analyzed by MAR-Wiz. MAR potential as a function of predicted binding to Top2 (threshold value = 0.6) is shown on the y axis. Numbers inside the peaks indicate the position at which the highest MAR potential in the area is located. (1 is the highest possible value for the MAR potential.) MAR-Wiz peaks located in non-conserved regions (2500 and 3100 nucleotides) or in the TNF 3′-UTR (11,000 nucleotides) or below the threshold level (300, 7200, and 16,800 nucleotides) were not considered putative MAR sites. Topo II, topoisomerase IIα.

