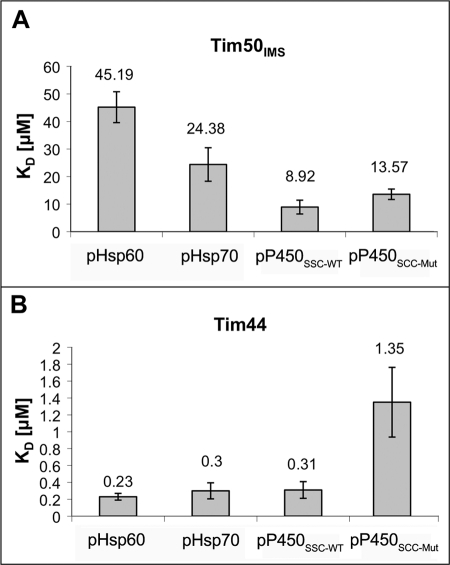
FIGURE 3.
Summary of SPR equilibrium analysis of Tim50IMS and Tim44 with the various presequences. Column diagrams summarizing the equilibrium KD values of Tim50IMS (A) and Tim44 (B) with the various presequences. The average KD of at least five measurements is indicated, and the error bars represent mean ± S.E.

