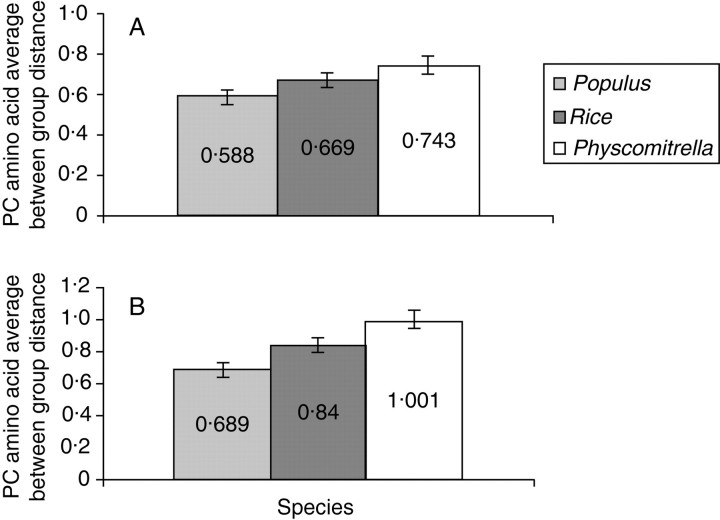
Fig. 4.
Average distances of Physcomitrella expansin gene families to their angiosperm counterparts. (A) Between group average distances for the EXPA gene family. Values indicated are the average Poisson-corrected amino acid distance to the arabidopsis EXPA family. Error bars are standard errors based on 500 bootstrap replicates. (B) Between group average distances for the EXPB gene family. Values indicated are the average Poisson-corrected amino acid distance to the arabidopsis EXPA family. Error bars are standard errors based on 500 bootstrap replicates.

