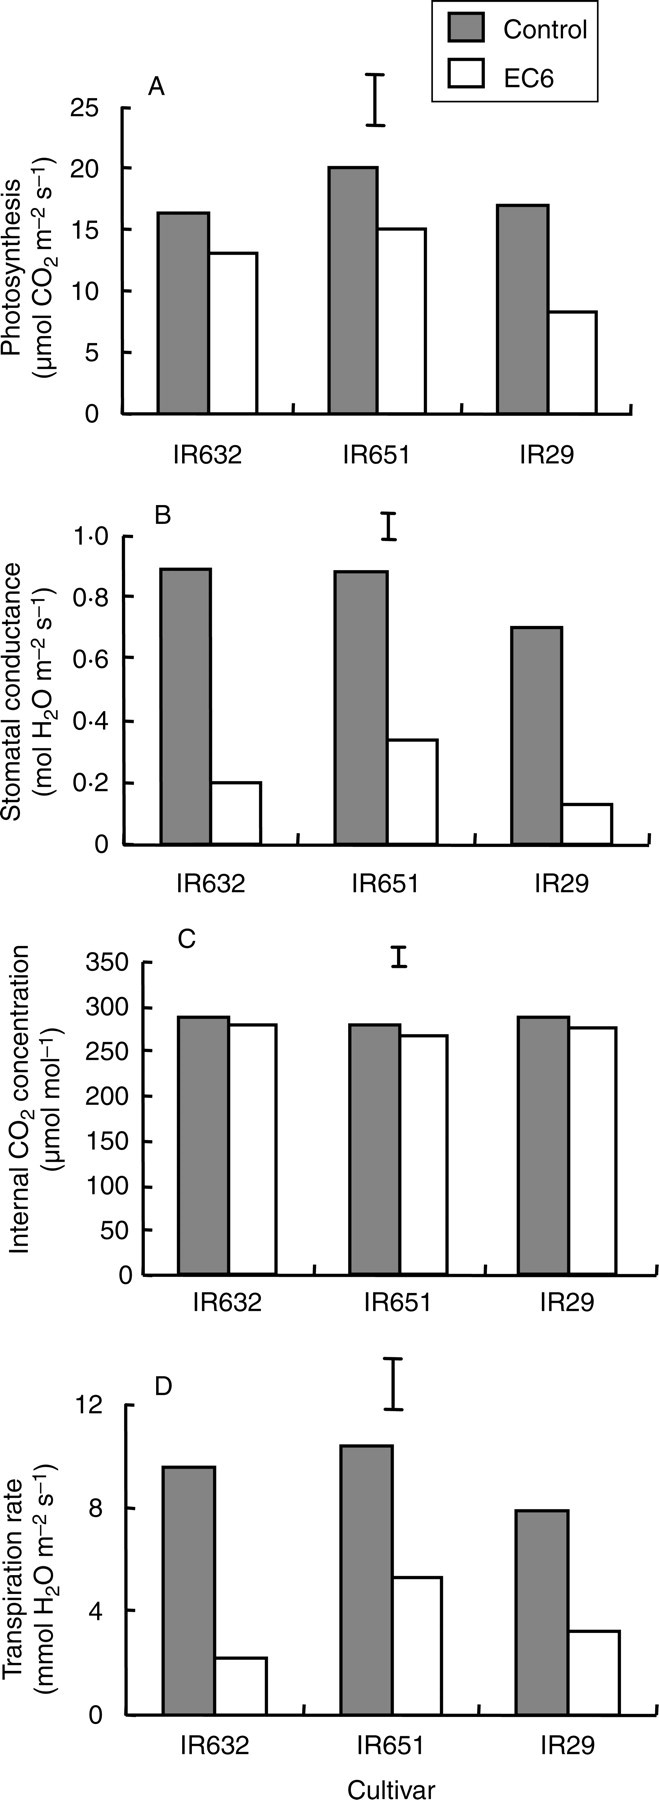
Fig. 2.

(A) Photosynthetic CO2 fixation, (B) stomatal conductance, (C) internal CO2 concentration and (D) transpiration rate of three rice cultivars measured using the flag leaf at flowering (35 d after the start of salt stress treatment) in experiment II. The data are mean values of three replications with four subsamples per replication. Vertical bars indicate LSD0·05.
