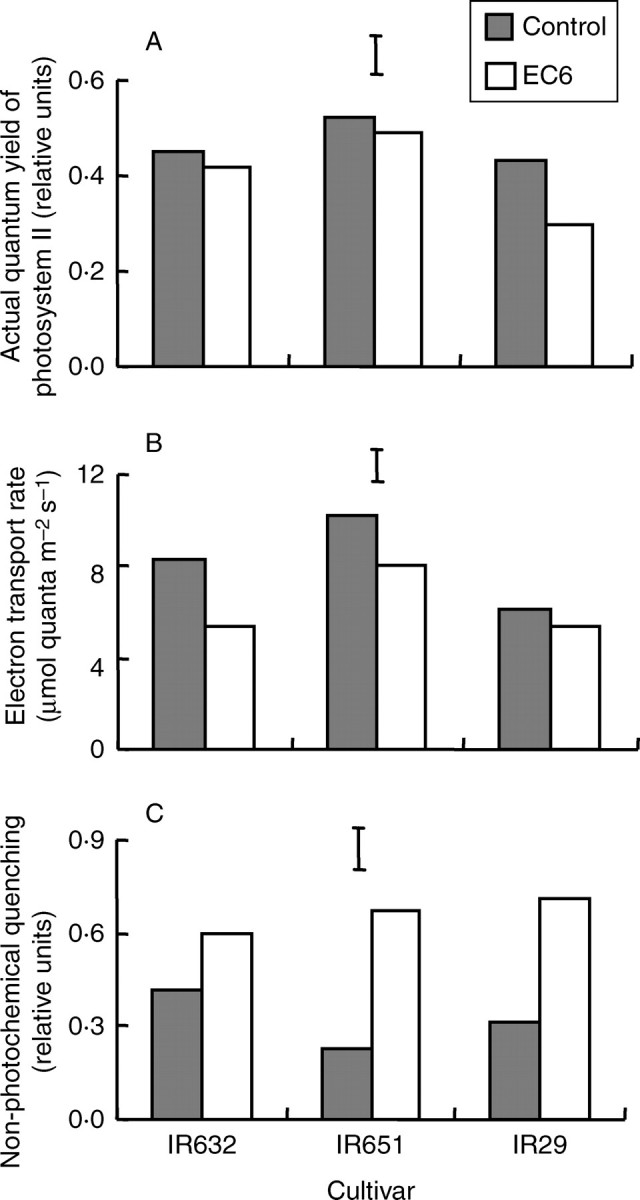
Fig. 4.

(A) Actual quantum yield of photosystem II (ΦPSII); (B) electron transport rate (ETR) and (C) non-photochemical quenching (qN) of chlorophyll fluorescence measured on the flag leaf of three rice cultivars at flowering (35 d after the start of salt stress treatment) in experiment II. The data are mean values of three replications and four sub-samples per replication. Vertical bars indicate LSD0·05.
