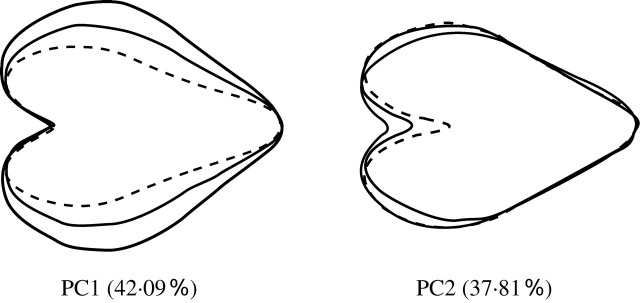
Fig. 1.
The effects of the first (PC1) and second (PC2) principal components on the petal shape of Primula sieboldii. Each shape was reconstructed using elliptic Fourier descriptors calculated by setting the score for the corresponding PC equal to its mean and to its mean plus or minus twice the standard deviation (±2 s.d.), and setting the scores for the remaining principal components to zero. Dashed, solid and thick solid lines represent the mean –2 s.d., the mean, and the mean + 2 s.d., respectively.

