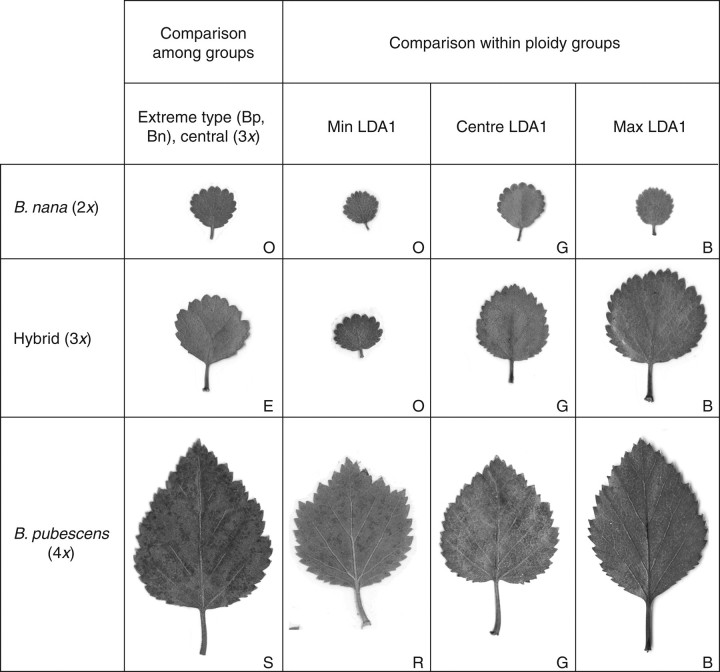
Fig. 6.
Leaves representing variation in the first axis of the linear discriminant analysis. The extreme types include the most Betula nana-like leaf from Blöndulón (O), the most B. pubescens-like leaf from the Bæjarstadarskógur woodland (S), and the most hybrid-like leaf from the Eidar woodland (E). Leaves representing variation within ploidy group are also shown, from the lowest (min LDA1), the middle/central, to the highest (max LDA1) values.

