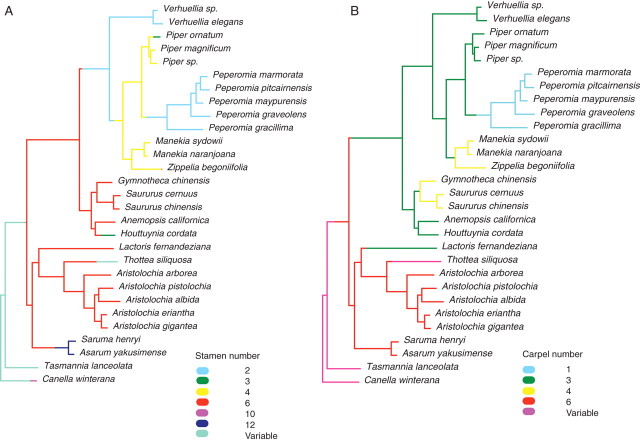
Fig. 2.
Ancestral state reconstruction, based on a Bayesian approach using the combined trnK/matK region and the trnT-L-F region in Piperales showing (A) stamen number and (B) carpel number. Colour changes between nodes indicate transitional states of the given characters (branch lengths are used as a rate for the occurrence of morphological change among taxa). Certain species have been replaced by closely related species within the two datasets (trnK/matK versus trnT-F) – see Table 1.

