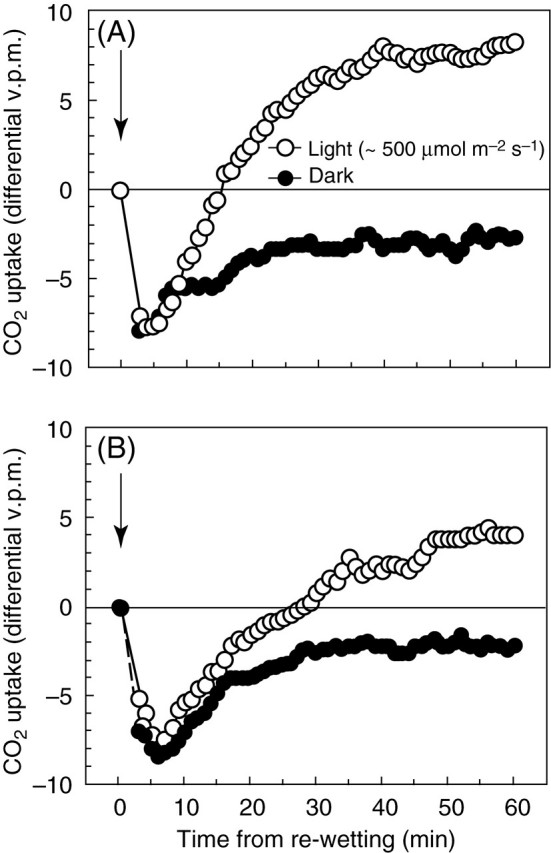
Fig. 3.

CO2 exchange of Polytrichum formosum following re-wetting in light (approx. 500 µmol m–2 s–1 PPFD) and dark; arrows show time of re-wetting. The curves are from approximately matched samples of eight 2-cm apical shoot lengths; the plotted points are running means of five readings taken at 30-s intervals. The data are not precise enough to allow interpretation of small differences between the dark and light curves during the first 10–15 min of recovery. (A) After 9 d of desiccation. The mean of the last 15 points was 7·93 (s.d. = 0·59); the mean after 24 h was 8·48 (s.d. = 0·65). (B) After 18 d of desiccation. The mean of the last 15 points of the light curve was 4·13 (s.d. = 0·64); the mean after 3 d of recovery was 11·02 (s.d. = 0·76). Data from two IRGA light-response curves (not shown), at 500 µmol m–2 s–1 PPFD (approx. –10·5 to –11·5 differential v.p.m.), is consistent with recovery to near pre-desiccation values within 12–24(–48) h.
