Figure 1.
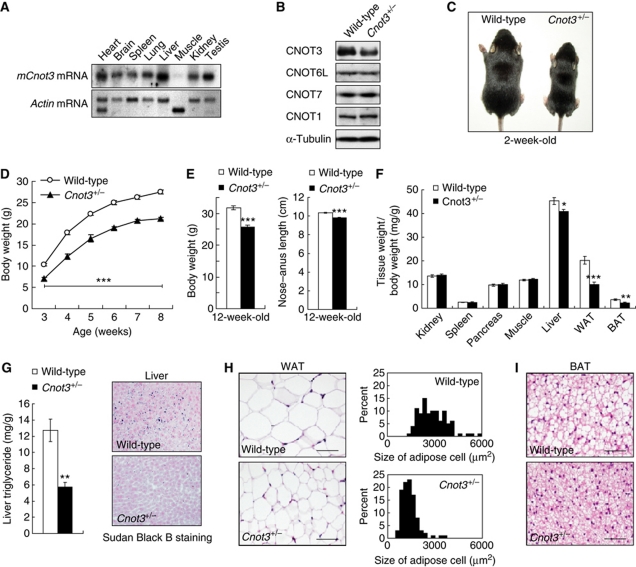
Leanness and reduced lipid content in Cnot3+/− mice. (A) Expression of Cnot3 mRNA in mouse tissue. A membrane filter containing mRNAs from multiple mouse tissues (Clontech) was hybridized with a probe specific for Cnot3. Actin-specific probe was used as a loading control. (B) Immunoblotting of CNOT3, CNOT6L, CNOT7, and CNOT1 protein in the Cnot3+/− livers. (C) Gross appearance of 2-week-old Cnot3+/− mice and wild-type littermates. (D) Growth curve of wild-type and Cnot3+/− mice from 3 to 8 weeks after birth. n=10 for each genotype. (E) Comparison of body weight (left) and body length (right) of 12-week-old Cnot3+/− mice and wild-type littermates. (F) The relative weight of the indicated organs. The weight of the organ was normalized to body weight. n=8–10 for each genotype. (G) Lipid levels in the liver. (Left panel) Liver triglyceride levels of 12-week-old wild-type and Cnot3+/− mice. Triglycerides in the homogenized liver were extracted with 2-propanol and measured with a Triglyceride E-Test Kit. n=5 for each genotype. (Right panel) Sudan Black B staining of liver sections from 12-week-old wild-type and Cnot3+/− mice. (H) Histological analysis of and cell size distribution in epididymal WATs of 12-week-old wild-type and Cnot3+/− mice. (I) Histological analysis of BATs of 12-week-old wild-type and Cnot3+/− mice. All values represent mean±s.e.m. *P<0.05; **P<0.01 and ***P<0.001.

