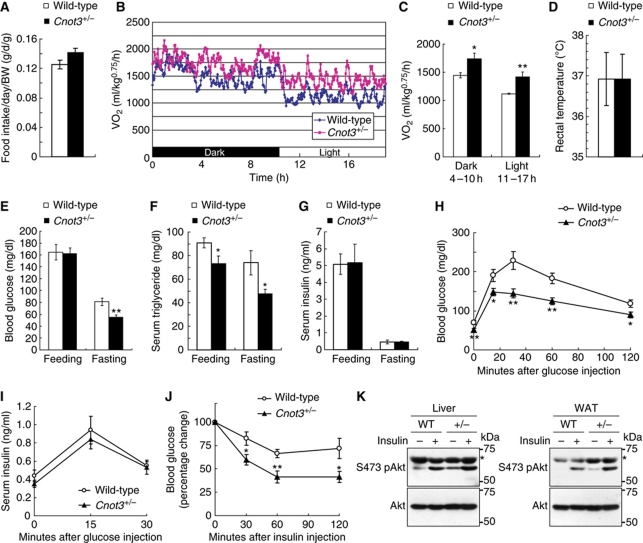
Figure 2.
Increased glucose homeostasis, insulin sensitivity, and metabolic rates in Cnot3+/− mice. (A) Average daily food intake normalized to body weight. Daily food intake per mouse was measured over 7 days. n=10 for each genotype. (B, C) Oxygen consumption (VO2) over 24 h (B) and average VO2 (C) of wild-type and Cnot3+/− mice. The data were normalized to body weight0.75. n=5 for each genotype. (D) Rectal temperatures of wild-type and Cnot3+/− mice. n=5 for each genotype. (E–G) Blood tests. Blood glucose levels (E), serum triglyceride concentrations (F), and serum insulin concentrations (G) in fed or fasted wild-type and Cnot3+/− mice. n=6–13 for each genotype. (H, I) Glucose tolerance tests. Mice were deprived of food for 16 h before the experiment. Blood glucose levels (H) and serum insulin levels (I) in wild-type and Cnot3+/− mice were measured at the indicated times following intraperitoneal injection of glucose. n=8–10 for each genotype. (J) Insulin tolerance tests. Blood glucose levels in wild-type and Cnot3+/− mice were measured at the indicated times following intraperitoneal injection of insulin. n=12 for each genotype. (K) Immunoblotting of phospho (Ser-473) and total Akt protein in the liver and WAT of wild-type and Cnot3+/− mice, with or without insulin stimulation. *Unspecific signals. All values represent mean±s.e.m. *P<0.05 and **P<0.01.

