Figure 3.
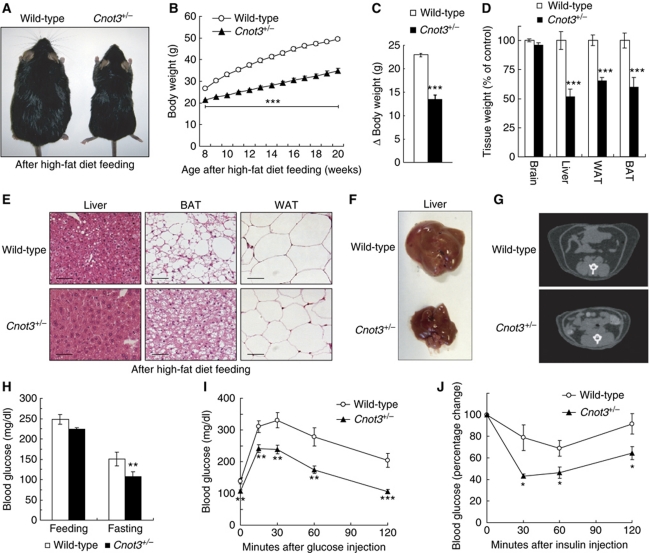
Resistance to diet-induced obesity and related metabolic disorder in Cnot3+/− mice. (A) Gross appearance of 20-week-old Cnot3+/− mice and their wild-type littermates after HFD feeding. (B) Growth curves of wild-type and Cnot3+/− mice during HFD feeding. n=16–20 for each genotype. HFD feeding started at 8 weeks of age. (C) Changes in body weight of wild-type and Cnot3+/− mice. n=16–20 for each genotype. (D) The relative weights of the indicated organs from wild-type and Cnot3+/− mice. n=6 for each genotype. (E) Histological analysis of the liver, epididymal WATs, and BATs of wild-type and Cnot3+/− mice. (F) Liver morphology of wild-type and Cnot3+/− mice at the end of HFD feeing. (G) CT scan analysis of wild-type and Cnot3+/− mice. (H) Blood glucose levels of wild-type and Cnot3+/− mice after 16 h of HFD feeding or fasting at the end of the HFD feeding. n=9–10 for each genotype. (I, J) Glucose and insulin tolerance tests. Blood glucose levels in wild-type and Cnot3+/− mice were measured at each indicated time point following intraperitoneal injection of glucose or insulin. n=8–10 for each genotype. All values represent mean±s.e.m. *P<0.05; **P<0.01 and **P<0.01.

